The Status View provides detailed information about certain long-running operations, such as Replaying a testcase. When no operation is in progress, it shows the current memory usage.
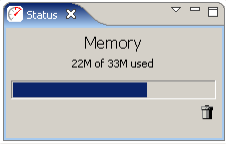
In default mode, the memory status is displayed. The numbers displayed reflect the heap memory usage - which is the space the program has available for creating and manipulating data. It does not include the memory consumed by the application code.
The ![]() button in the corner
runs the garbage collector to recycle memory that is no longer being used.
Note that you are never required to push this button manually - the garbage
collector automatically runs when needed. But some people really like
pushing buttons, so we added one!
button in the corner
runs the garbage collector to recycle memory that is no longer being used.
Note that you are never required to push this button manually - the garbage
collector automatically runs when needed. But some people really like
pushing buttons, so we added one!
While recording, the Status View displays the current state of the recording:
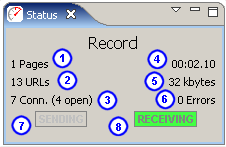
Shortly after a recording ends, the Status View will automatically return to displaying the memory status.
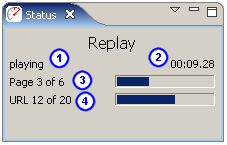
During a replay, the Status View displays the current state of the replay:
Shortly after a replay ends, the Status View will automatically return to displaying the memory status.
While repository files are opening, the Status View will display the progress of the operation:
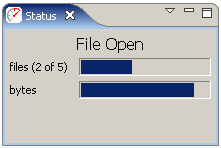
Shortly after the files have been read, the Status View will automatically return to displaying the memory status.
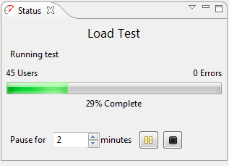
During a load test, the status view will show the progress of the load test. The Pause option will cause the test plan to hold at a steady state for a finite period of time. When you click the pause button, the pause may not begin until commands already dispatched to the load engine reach their natural conclusion. In this case, the pause will be queued, just like any other test plan step.
The Stop button ends the load test. If you allow virtual users to exit their workflow naturally before stopping, you can force the load test to stop immediately by clicking the red stop button that appears after the load test enters the stopping phase (not shown).
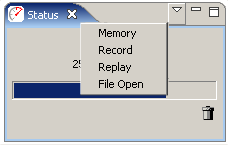
The Status View will typically select the best mode for displaying information relevant to the current operation. The mode may be manually selected using the drop-down menu at the top of the view..