For more information about server monitoring, see the Introduction to Server Monitoring page.
The Web Performance line of products are capable of monitoring two important metrics on your server(s): CPU utilization (%) and memory usage (%). You may make the appropriate configurations to configure these metrics through the Servers View.
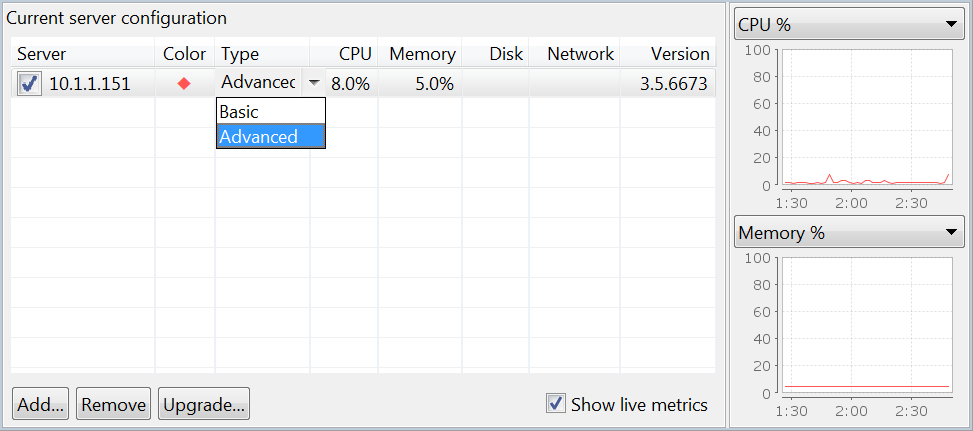
When you open the Servers View, you will be presented with a list of servers which are presently configured for monitoring. The graph on the right side of the view displays information being actively observed from your server. The check box next to the host name may be used to toggle whether or not the particular server is being actively monitored.
To start monitoring a new server, you may need to first add the server to the view, depending on the type of server monitoring you are using. See the Basic Server Monitoring and Advanced Server Monitoring pages for more information. To monitor a server during a load test, be sure the server is selected (via the checkboxes in the view) before starting the load test.
The following options may be used to manage the Server Monitoring configuration.
Additionally, the following controls may be used to configure Server Monitoring Agents.
The Servers View can also be used to display server metrics for a given series of load test results. In order to do this, simply uncheck the option to Show live metrics, and open a set of results. The view will update to display previously gathered information from the selected test. In order to switch back to the active configuration, simply re-check the Show live metrics option.