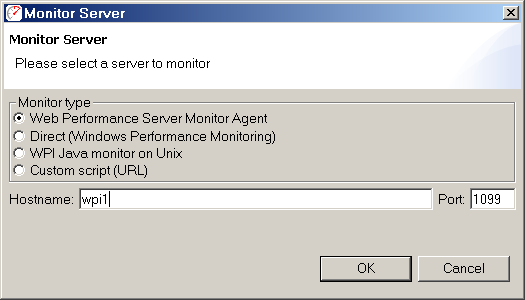
To start monitoring a new server, simply press the Add... button in the Servers View. This dialog will appear:
Here, you must decide what style of server monitoring to use. Four styles are supported:
Once a configuration has been selected, and the required fields filled in, pressing the "OK" button will attempt to connect to the server and verify that the server can be successfully monitored under normal conditions. Upon verification, the server will be added to the list of servers for metrics gathering during a load test.
This option may be used to connect to an installed and running copy of the Web Performance Server Monitoring Agent. Typically, the agents are automatically detected and enabled. However, depending on network conditions, it may be necessary to add the configuration manually by entering either the IP Address or hostname of the server on which the agent is running.
If the agent has been configured to use a specific port, then the specified value of the RmiRegistryPort should be entered in the Port option. Otherwise, the default port is 1099.
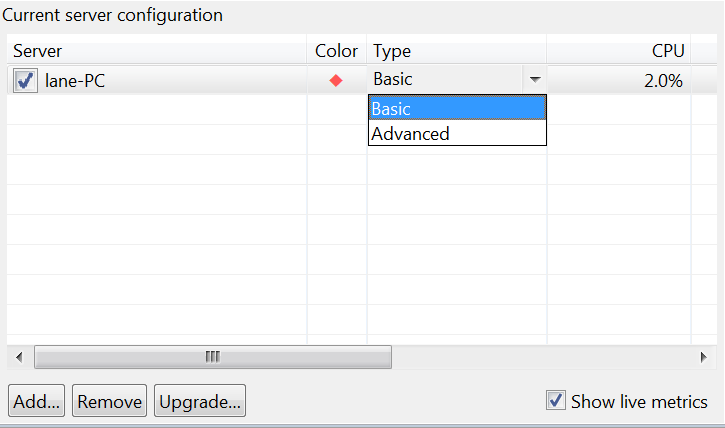
Server monitor agents will be initialised in advanced mode by default, but if you do not wish to purchase the applicable license, you may still use the server monitor agent in basic mode by configuring it in the servers view.
No server-side installation is necessary. However, the user running Web Performance Load Tester must have the appropriate Windows privileges to monitor the server. See your network administrator for details.
|
|
|
The direct windows monitoring is the equivalent of using the Windows Performance Monitor (perfmon.exe) to monitor the % Committed Bytes In Use counter of the Memory performance object on the remote server.
Install the WPIMonitor.war file in your server in the usual deployment folder. It will install a servlet named Monitor in the path /WPIMonitor/monitor.
|
|
|
If necessary, you may modify the deployment descriptor for the servlet as necessary for your environment. However, if you change the path required to access the monitoring servlet, then you must configure the monitoring within Web Performance Load Tester as a custom script installation and provide the full URL to the Monitor servlet.
Web Performance can monitor any server via HTTP if a customized script is developed to return the server CPU% and memory% in the supported format. The following plain text content format is supported (MIME type text/plain):
version=1
CPU%=nnn
memory%=nnn
After writing and testing your script, enter the URL of the script into the URL field of the configuration dialog.