Open topic with navigation
Testcase Editor
The Testcase Editor is used to view details
of the testcase and the replays of the testcase. The Testcase Editor initially
presents the test case as a tree of web pages, URLs. Opening the page
(click the expander) will display the additional resources requested for the
page (images, style sheets, etc.). When a new testcase is recorded, a
Testcase Editor window is opened and displays the transactions as they
are recorded. The Testcase Editor can also display comparisons between a replay and the recorded content.
Stepped Order View
The Stepped Order view shows the resources in the testcase, in the order that they will be supplied for a Virtual User to run. A Testcase is made up of a sequence of Web Pages. Within each Web Page are the resources that were requested from the server when the page was displayed in the browser.
This is the default mode of the editor. To switch from another mode back to Stepped Order, simply select "Options", then select "Stepped Order".
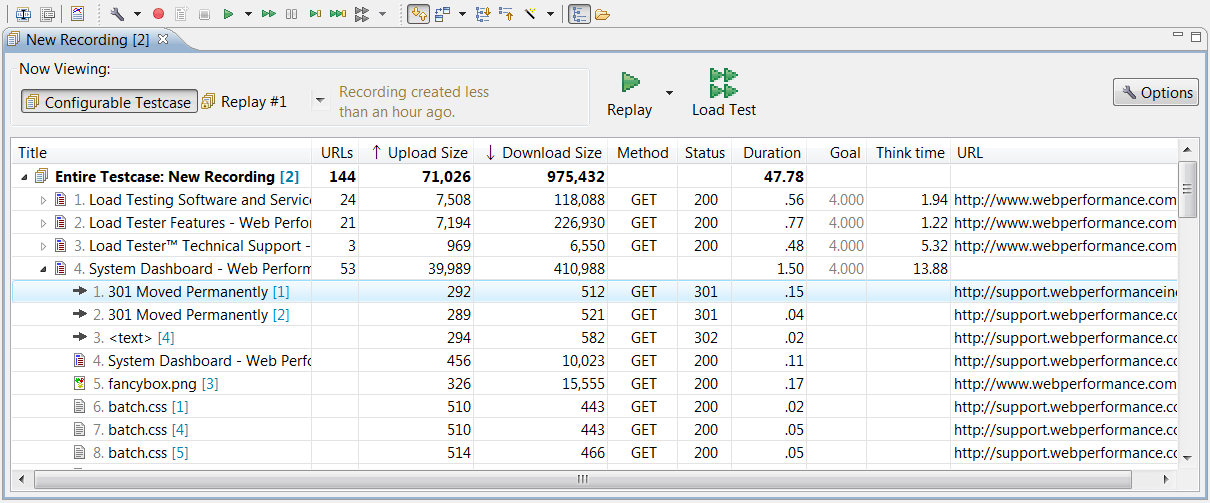
Basic controls:
- Now Viewing: This section allows you to switch between viewing the configurable testcase, and the replayed contents of that testcase.
- Replay: Runs a new Replay of your testcase.
- Load Test: Prepares a Load Configuration for this testcase, which can be used to run a Load Test.
- Options: Contains options to configure the display and the testcase.
The editor displays the following columns:
- Title: A logical
name for the item. For web pages, the title will be extracted from the
document. For other resources, a best-guess will be made, such as a filename.
If the same resource appears multiple times, the titles will be numbered
to avoid confusion. There are icons for web
pages (
 ), text files (
 ), images (
 ), forwards (
 ) and errors (
 ). This field may be edited (double click to edit).
- URLs: The number of resources which were loaded by the browser. For a web page, this will show how many new HTTP requests had to be made in order to load the page. The "Entire Testcase" row will show the total number of HTTP transactions in the entire testcase.
- Upload / Download Size: the total number of bytes uploaded or downloaded for the item.
- Size: the total size of the item (upload + download size).
- Method: the HTTP Method used to request the resource from the server.
- Status: the HTTP
code received in the response from the server.
- Duration: the amount
of time taken to load the item. For web pages, this is the total time
taken to load all items on the page. For the entire testcase, this shows how long the testcase took to record, which is the combination of resource load time and think time. The format is MM:SS:mmm
(minutes, seconds, milliseconds). If a performance goal failed for an item in the testcase, a
warning icon (
 ) is displayed at the beginning of the column.
Placing the mouse over the icon shows the cause of the performance warning.
) is displayed at the beginning of the column.
Placing the mouse over the icon shows the cause of the performance warning.
- Goal: The performance
goal configured for this item. Blank if no goal has been configured, or gray where the default goal is being used. This field may be edited (double click to edit).
- Think Time: The
amount of time the Virtual User will pause between pages (to emulate the
time the user spend reading the page or entering data). Applies only to
web pages. This field may be edited (double click to edit).
- URL: the URL of
the item, preceded by an icon representing the type of item (e.g. text,
graphics). Secure transactions (those requested using HTTPS) will display a
locked icon (
 ). This field may be edited (double click to edit).
URL Editor View
The URL Editor View breaks down the resources requested in the testcase by URL. This allows a quick measurement of traffic generated by the testcase to different servers or paths.
To switch to URL Editor mode, simply select "Options", then select "URL Editor".
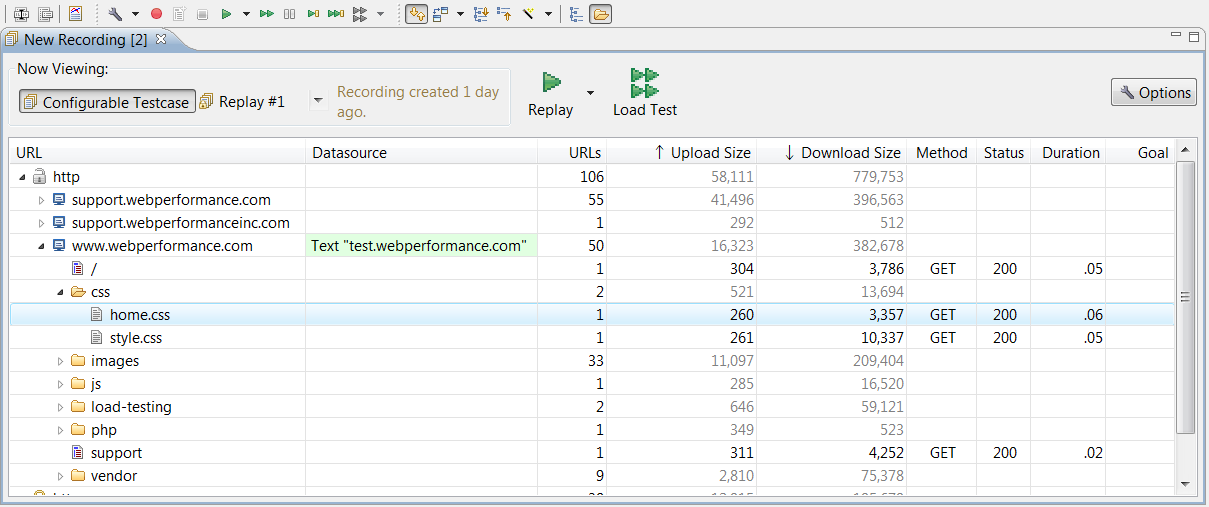
To remove all resources from the testcase directed at a server or URL path, simply right click on the server or path, and select "Delete".
Datasource: The "Datasource" column allows an alternate name to be specified for a selected component. To edit the datasource, simply double-click the datasource column, and select a replacement value. In the example above, all traffic recorded on "www.webperformance.com" will be redirected to "test.webperformance.com" the next time the testcase is replayed.
Options
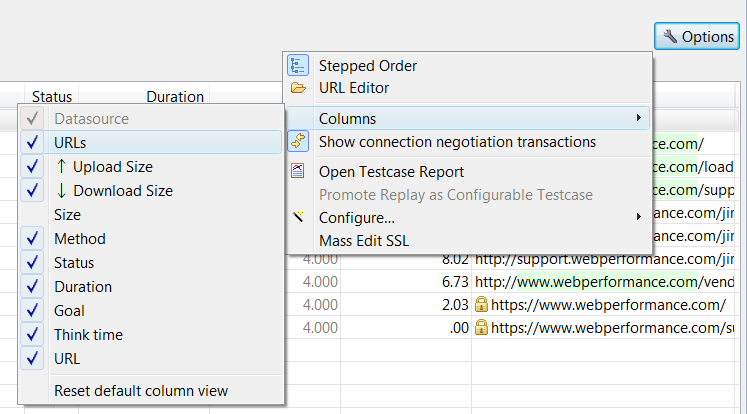
The following options are available:
- Stepped Order: Switch to the Stepped Order view mode
- URL Editor: Switch to the URL Editor view mode
- Columns: allows various columns to be hidden or shown in the editor by checking the desired column names.
- Show connection negotiation transactions: Enables whether or not the recorded HTTP messages needed to secure negotiate HTTP authentication with the web server are displayed. See Authentication for more information.
- Open Testcase Report
- Promote Replay as Configurable Testcase: This option allows the selected Replay to be promoted to the configurable testcase. This can be used when resources on the site have changed in size and duration, and the new durations and page sizes should be used when Load Tester estimates how long a test plan will run, and the traffic to the site (such as in the Baseline Load Test Report). This will result in several changes to the structure of the testcase:
- All user-defined actors from the original recording will be copied from the base testcase (original recording) to the replay.
- All replays, except the promoted replay, will be deleted.
- The original recording will be deleted.
- The promoted replay will become the base testcase and will, for all intents and purposes, become the original recording.
- Automatically-applied configurations will be cleared - replaying the testcase or using in a load test will require completion of the Replay Configuration wizards (authentication, ASM, etc).
- Configure: Allows the entire testcase to be reconfigured by Load Tester's Testcase Configuration Wizards, or reset to the recorded configuration.
- Mass Edit SSL: Allows the SSL configuration of many URLs in the same testcase to be changed to HTTP or HTTPS.
Open topic with navigation