As soon a replay has been initiated, it appears in the replay selection list, as shown below. The testcase editor reflects the performance measurements of the selected replay for the testcase.

To easily see the performance differences between two replays (or a replay and the original recording), select the Compare to... menu item in the Testcase Editor menu. The testcase editor adds new columns that show the changes in the size and duration of each page and URL in the testcase.


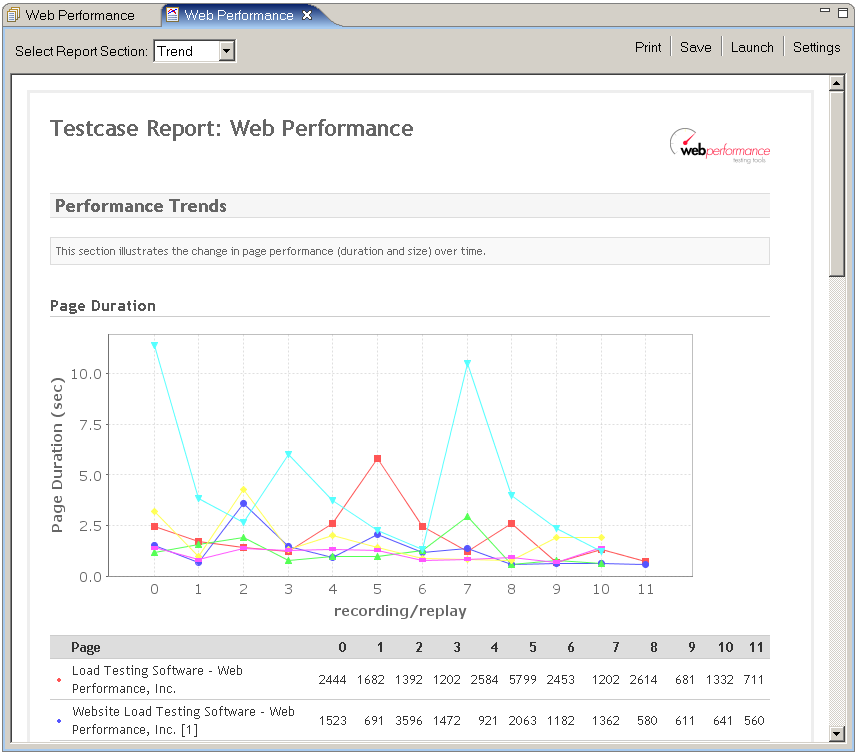
To display the changes in performance of web pages over more than two replays, open the Testcase Report . For example, selecting the Open Report item from the Testcase Editor menu. Then navigate to the Trend section of the report.
